Watchlists ∞
A watchlist is a set of points in the sky, together with a radius in arcseconds, which can be the same for all sources, or different for each. It is assumed to be a list of “interesting” sources, so that any transient that falls within the radius of one of the sources might indicate activity of that source. Each user of the Lasair system has their own set of watchlists, and can be alerted when a transient is coincident with a watchlist source. Here, the word coincident means within the radius of the source. An “Active” watchlist is one that is run every day, so that it is up to date with the latest objects.
Create new watchlist ∞
You can create a watchlist of sources by preparing a text file, where each comma-separated or |-separated line has RA and Dec in decimal degrees, an identifier, with optional radius in arcseconds. One way to do this is with Vizier (see below) or with a spreadsheet program such as Excel or Numbers.
Here is an example of the data. The 42 entries are BL Lac candidates for TeV observations (Massaro+, 2013)
Note that you must be logged in to create a watchlist.
Many astronomers are interested in transients that are associated with specific astronomical objects, perhaps active galaxies or star formation regions. Once you have an account on Lasair, you can create any number of watchlists, to be used in the query engine. To be specific, suppose we are interested in the 42 objects in the catalogue BL Lac candidates for TeV observations (Massaro+, 2013), that can be found in the Vizier library of catalogues. You can make your watchlist “public”, so other Lasair users can see it and use it in queries, and you can make your watchlist “active”, meaning that the crossmatch (see below) is done automatically every day.
The following is how to make the correct file format from Vizier.
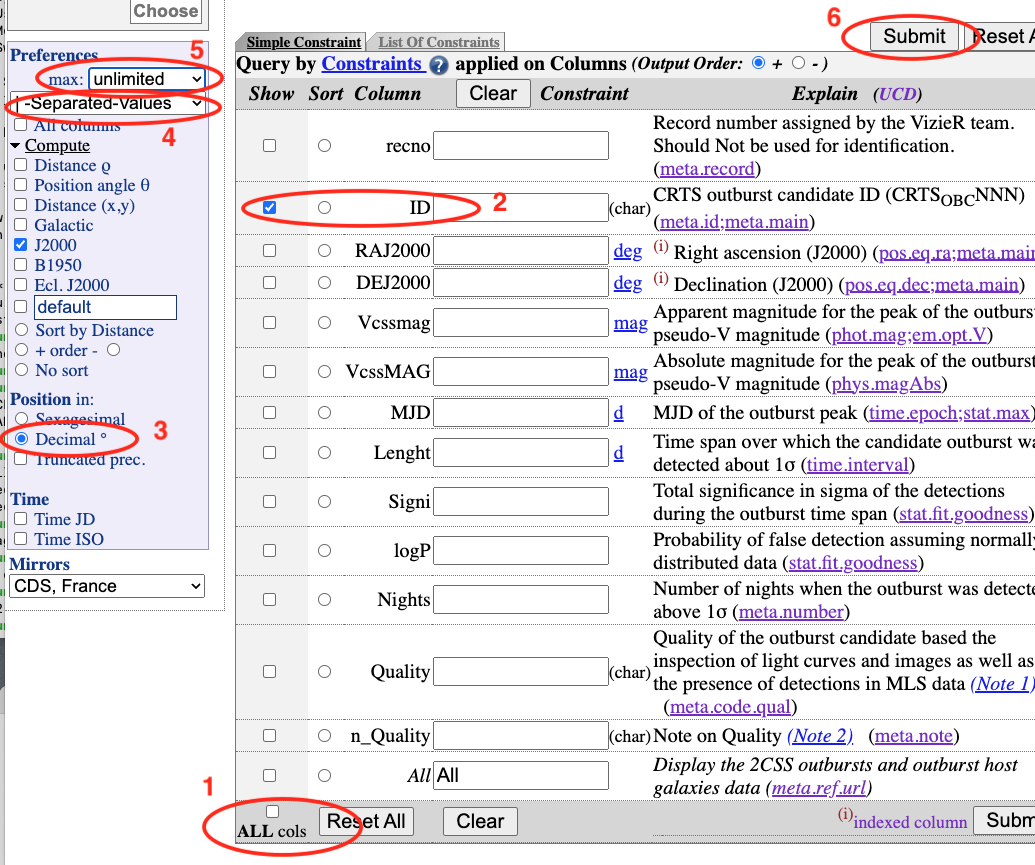
First you select a catalogue, which may consist of a number of tables. Select JUST ONE TABLE, so that there is just a single list of attributes. For example, this link has two tables, but this link is for a single table.
Once you have selected your table,
Deselect all the columns
Select a column that can act as the identifier for each source. These need to be unique and not empty: if not, you must edit the resulting file to make it so.
Choose “Decimal” for the coordinates
Choose “|-separated” for the format
Select “unlimited” or however many you want in your watchlist
Click submit to download the file.
Once you have the file, you can paste it into a form, or upload the file directly.
There may be error messages about unparsable lines, which can be eliminated by
editing the file so every non-numerical line begins with the # symbol.
The upload form is shown here:
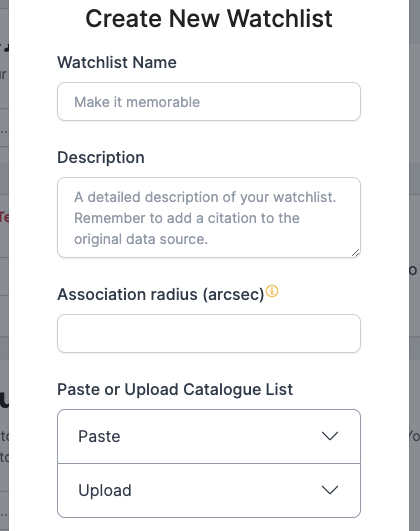
Fill in the name and description of the watchlist. Choose a default value of the radius to use in matching, in arcseconds. Each line should be RA, Dec, ID, and may have a fourth entry, the radius to use in matching, in arcseconds, if different from the default. Then click “Create”.
Here is a successful creation of a watchlist. Some messages – “Bad line” – because there were some lines without data, but you can ignore these, and look for where it says “Watchlist created successfully”. You can now find it in the list of “My Watchlists”.
Find outbursts from my watchlist ∞
Once you have made a watchlist, you may be interested in being notified whenever something unusual – outburst for example – happens to one of your sources. Thus we combine a watchlist with a query on magnitude that detects fast rise. For the watch list see Build a Watchlist of your sources, and for the query we utilise the moving averages of apparent magnitudes that Lasair provides.